Market Outlook
July 25, 2017
Market Cues
Domestic Indices
Chg (%)
(Pts)
(Close)
Indian markets are likely to open flat tracking global indices and SGX Nifty.
BSE Sensex
0.7
217
32,246
US markets had a mixed session with tech stocks gaining ground while the broader
Nifty
0.5
51
9,966
market slipped lower. The National Association of Realtors (NAR) released a report
Mid Cap
0.3
41
15,226
showing a bigger than expected drop in existing home sales in the month of June
Small Cap
0.3
143
16,036
2017. Existing home sales dropped by 1.8 percent against an expectation of a drop
Bankex
0.5
139
27,635
of 1.0 percent. The NYSE Arca Gold Bugs Index dropped by 2.4 percent as gold
prices weakened by $0.6 to $1,254.30 an ounce.
Global Indices
Chg (%)
(Pts)
(Close)
The UK markets fell lower as the IMF announced a cut to its GDP growth forecast.
The IHS Markit's household finance index dropped to 41.8 in July from 43.7 in June,
Dow Jones
(0.3)
(67)
21,513
signaling a fast deterioration in financial wellbeing for UK households. Airliner
Nasdaq
0.4
23
6,411
Ryanair fell by 1.4 percent after the budget airline said it expects airline pricing to
FTSE
(1.0)
(75)
7,378
remain under pressure for the second half of the year.
Nikkei
(0.6)
(124)
19,976
Indian markets moved closer to the 10,000 mark as index heavy weights help push
Hang Seng
0.5
141
26,847
the market to an all time high. Reliance Industries continued its rally from yesterday
Shanghai Com
0.4
13
3,251
and closed up 1.9 percent. HDFC Bank closed up 1.8 percent on good earnings.
ITC also closed up 1.6 percent on news that the company had hiked prices last
Advances / Declines
BSE
NSE
week. Wipro Ltd closed up 1.7 percent on announcement of a share buyback by the
company.
Advances
1,325
1,819
Declines
1,429
875
Result update
Unchanged
167
74
HDFC Bank Q1FY18 Result Review
Detailed analysis is on Pg2
Volumes (` Cr)
BSE
3,737
Investor’s Ready Reckoner
NSE
26,875
Key Domestic & Global Indicators
Stock Watch: Latest investment recommendations on 150+ stocks
#Net Inflows (` Cr)
Net
Mtd
Ytd
Refer Pg7 onwards
FII
(5(102)
(21,420
57,328
Top Picks
MFs
804
98
4,990
44,136
CMP
Target
Upside
Company
Sector
Rating
(`)
(`)
(%)
Blue Star
Capital Goods
Accumulate
671
760
13.3
Top Gainers
Price (`)
Chg (%)
Dewan Housing FinanceFinancials
Accumulate
456
520
14.1
Welcorp
133
8.9
Mahindra Lifespace
Real Estate
Buy
435
522
20.0
J&Kbank
90
7.2
Navkar Corporation
Others
Buy
205
265
29.2
Hcc
42
5.5
KEI Industries
Capital Goods
Accumulate
233
258
10.7
More Top Picks on Pg5
Albk
76
4.7
Symphony
1,412
4.7
Key Upcoming Events
Previous
Consensus
Date
Region
Event Description
Reading
Expectations
Top Losers
Price (`)
Chg (%)
Jul 25, 2017
US
Existing home sales
5.62
5.57
Fretail
410
(6.0)
Jul 26, 2017
UK
GDP (YoY)
2.00
1.70
Jul 26, 2017
US
Initial Jobless claims
233.00
240.00
Mrpl
120
(5.5)
Jul 26, 2017
US
New home sales
610.00
615.00
Divislab
687
(4.7)
Jul 27, 2017
US
FOMC rate decision
1.25
1.25
Atul
2,211
(3.8)
More Events on Pg7
Lakshvilas
197
(3.2)
#as on 24t July, 2017
Market Outlook
July 25, 2017
Result Review
HDFC Bank Q1FY18 Result Review
HDFC Bank came out with yet another quarter of good results. Loan growth of
23% and Deposit growth of 17% were marginally ahead of our expectations.
Further easing of cost of funds has enabled in improvement in NIM which stood at
4.4% vs 4.3% QoQ. However, with increasing competition even the bank believes
the margins could soften a bit. Asset quality of the bank saw some stress during
the quarter as GNPAs went up by 19 bps to 1.25%. However, the management
has clarified that 60% of the incremental slippages were from the agriculture
segment.
A series of loan waivers across large sates, impacted the credit discipline among
agri borrowers and hence the rise in NPAs. The bank has maintained that there
could be some stress on the agri loan portfolio going ahead also. However, given
that the core loan portfolio has remained largely stable and growth rates have
picked up again, the earnings visibility remains fairly stable for the bank. At the
CMP the stock trades at 3.7x its FY19 Adj BV. We believe HDFC Bank will continue
to attract premium valuations and we have an ACCUMULATE rating on the stock.
Economic and Political News
Direct investments by Indian firms abroad plunged by 46 per cent to $1.12
bln in June 2017 from $2.07 bln in June 2016
19% of country's population financially excluded: Assocham-EY report
29 mineral blocks worth `1.56 lakh crore auctioned as on date: Mines
minister
FDI grows by 23 per cent to $10.02 bln during April-May 2017
Corporate News
M&M to try and regain market share with launch of 3 new utility vehicles, to
phase out Xylo eventually
Mahindra Finance Q1FY18 profit drops 46% YoY to `58cr
Indiabulls Real Estate Q1FY18 net profit up 29% YoY at `153cr
IRB Infra reports 31 percent rise in consolidated net profit to `237.8cr in
Q1FY18
Market Outlook
July 25, 2017
Quarterly Bloomberg Brokers Consensus Estimate
Axis Bank Ltd - July 25, 2017
Particulars ( ` cr)
1QFY18E
1QFY17
y-o-y (%)
4QFY17
q-o-q (%)
Net profit
1,274
1,556
(18.1)
1,225
4.0
Vedanta - July 25, 2017
Particulars ( ` cr)
1QFY18E
1QFY17
y-o-y (%)
4QFY17
q-o-q (%)
Net sales
18,172
14,364
26.5
22,511
(19.3)
EBITDA
5,264
3,506
50.1
7,350
(28.4)
EBITDA margin (%)
29.0
24.4
32.7
Net profit
1,575
615
156.0
1,491
5.6
Bharti Airtel Ltd. - July 25, 2017
Particulars ( ` cr)
1QFY18E
1QFY17
y-o-y (%)
4QFY17
q-o-q (%)
Net sales
21,855
25,547
(14.5)
21,935
(0.4)
EBITDA
7,531
9,575
(21.3)
7,906
(4.7)
EBITDA margin (%)
34.5
37.5
36.0
Net profit
240
1,462
(83.6)
767
(68.7)
Asian Paints Ltd. - July 25, 2017
Particulars ( ` cr)
1QFY18E
1QFY17
y-o-y (%)
4QFY17
q-o-q (%)
Net sales
3,990
3,590
11.1
3,952
1.0
EBITDA
832
820
1.4
712
16.8
EBITDA margin (%)
20.8
22.8
18.0
Net profit
537
535
0.3
480
11.9
Hero Motor Corp Ltd. - July 25, 2017
Particulars ( ` cr)
1QFY18E
1QFY17
y-o-y (%)
4QFY17
q-o-q (%)
Net sales
8,053
7,290
10.5
6,915
16.4
EBITDA
1,280
1,230
4.1
958
33.7
EBITDA margin (%)
15.9
16.9
13.8
Net profit
912
883
3.3
718
27.1
Pidilite Industries - July 25, 2017
Particulars ( ` cr)
1QFY18E
1QFY17
y-o-y (%)
4QFY17
q-o-q (%)
Net sales
1625
1683
(3.5)
1295
25.5
EBITDA
329
393
(16.3)
257
28.0
EBITDA margin (%)
20.3
23.3
19.8
Net profit
262
272
(3.7)
157
66.9
Market Outlook
July 25, 2017
Top Picks
Market Cap
CMP
Target
Upside
Company
Rationale
(` Cr)
(`)
(`)
(%)
Strong growth in domestic business due to its leadership
in acute therapeutic segment. Alkem expects to launch
Alkem Laboratories
21,487
1,797
2,161
20.2
more products in USA, which bodes for its international
business.
We expect the company would report strong profitability
Asian Granito
1,283
426
480
12.6
owing to better product mix, higher B2C sales and
amalgamation synergy.
Favourable outlook for the AC industry to augur well for
Cooling products business which is out pacing the
Blue Star
6,422
671
760
13.3
market growth. EMPPAC division's profitability to improve
once operating environment turns around.
With a focus on the low and medium income (LMI)
consumer segment, the company has increased its
Dewan Housing Finance
14,295
456
520
14.1
presence in tier-II & III cities where the growth
opportunity is immense.
Loan growth is likely to pick up after a sluggish FY17.
Karur Vysya Bank
8,509
141
160
13.6
Lower credit cost will help in strong bottomline growth.
Increasing share of CASA will help in NIM improvement.
High order book execution in EPC segment, rising B2C
KEI Industries
1,813
233
258
10.7
sales and higher exports to boost the revenues and
profitability
Speedier execution and speedier sales, strong revenue
Mahindra Lifespace
2,233
435
522
20.0
visibilty in short-to-long run, attractive valuations
Massive capacity expansion along with rail advantage at
Navkar Corporation
2,924
205
265
29.2
ICD as well CFS augurs well for the company
Strong brands and distribution network would boost
Siyaram Silk Mills
2,178
2,324
2,500
3.0
growth going ahead. Stock currently trades at an
inexpensive valuation.
Market leadership in Hindi news genre and no.
2
viewership ranking in English news genre, exit from the
TV Today Network
1,486
249
344
38.1
radio business, and anticipated growth in ad spends by
corporates to benefit the stock.
After GST, the company is expected to see higher
volumes along with improving product mix. The Gujarat
Maruti
2,28,128
7,552
8,495
12.5
plant will also enable higher operating leverage which
will be margin accretive.
Source: Company, Angel Research,
Market Outlook
July 25, 2017
Key Upcoming Events
Global economic events release calendar
Bloomberg Data
Date
Time
Country
Event Description
Unit
Period
Last Reported
Estimated
Jul 25, 2017
7:30 PMUS
Existing home sales
Million
Jun
5.62
5.57
Jul 26, 2017
2:00 PMUK
GDP (YoY)
% Change
2Q A
2.00
1.70
6:00 PMUS
Initial Jobless claims
Thousands
Jul 22
233.00
240.00
7:30 PMUS
New home sales
Thousands
Jun
610.00
615.00
Jul 27, 2017
11:30 PMUS
FOMC rate decision
%
Jul 26
1.25
1.25
Jul 28, 2017
2:30 PMEuro Zone
Euro-Zone Consumer Confidence
Value
Jul F
(1.70)
(1.70)
6:00 PMUS
GDP Qoq (Annualised)
% Change
2Q A
1.40
2.50
Jul 31, 2017
6:30 AMChina
PMI Manufacturing
Value
Jul
51.70
51.40
Aug 01, 2017
1:25 PMGermany
Unemployment change (000's)
Thousands
Jul
7.00
2:00 PMUK
PMI Manufacturing
Value
Jul
54.30
2:30 PMEuro Zone
Euro-Zone GDP s.a. (QoQ)
% Change
2Q A
0.60
Aug 02, 2017
2:30 PMIndia
RBI Reverse Repo rate
%
Aug 2
6.00
2:30 PMIndia
RBI Repo rate
%
Aug 2
6.25
2:30 PMIndia
RBI Cash Reserve ratio
%
Aug 2
4.00
Aug 03, 2017
6:00 PMUS
Change in Nonfarm payrolls
Thousands
Jul
222.00
175.00
Aug 04, 2017
4:30 PMUK
BOE Announces rates
% Ratio
Aug 3
0.25
0.25
6:00 PMUS
Unnemployment rate
%
Jul
4.40
4.30
Aug 08, 2017
China
Exports YoY%
% Change
Jul
11.30
Aug 09, 2017
7:00 AMChina
Consumer Price Index (YoY)
% Change
Jul
1.50
Aug 10, 2017
India
Imports YoY%
% Change
Jul
19.00
India
Exports YoY%
% Change
Jul
4.40
Source: Bloomberg, Angel Research
Market Outlook
July 25, 2017
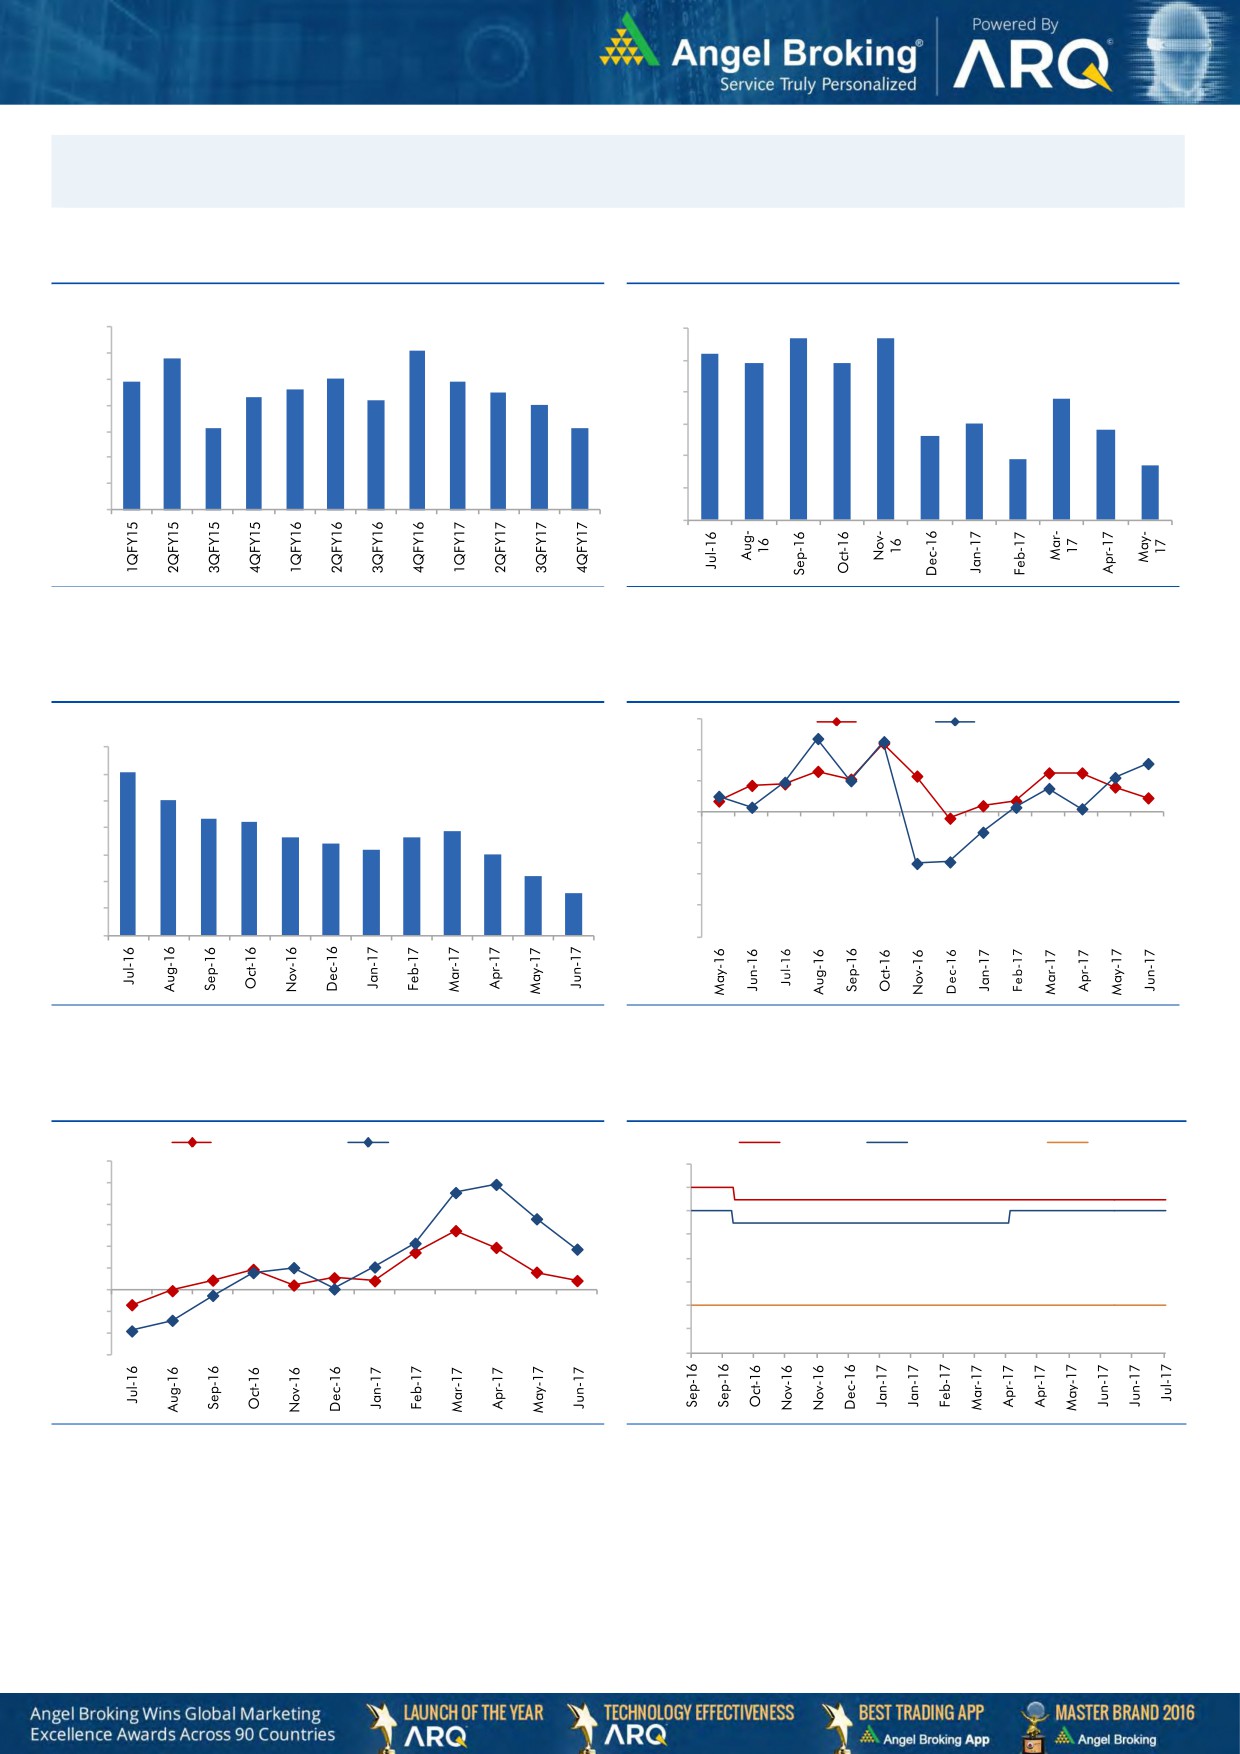
Macro watch
Exhibit 1: Quarterly GDP trends
Exhibit 2: IIP trends
(%)
(%)
5.7
5.7
10.0
6.0
9.1
5.2
8.8
4.9
4.9
9.0
7.9
8.0
7.9
5.0
7.6
7.5
8.0
7.3
7.2
3.8
7.0
4.0
7.0
3.0
6.1
6.1
2.8
2.6
3.0
6.0
1.9
1.7
5.0
2.0
4.0
1.0
3.0
-
Source: CSO, Angel Research
Source: MOSPI, Angel Research
Exhibit 3: Monthly CPI inflation trends
Exhibit 4: Manufacturing and services PMI
56.0
Mfg. PMI
Services PMI
(%)
7.0
54.0
6.1
6.0
5.1
52.0
5.0
4.3
4.2
3.9
50.0
3.6
3.7
4.0
3.4
3.2
3.0
48.0
3.0
2.2
1.5
46.0
2.0
1.0
44.0
-
42.0
Source: MOSPI, Angel Research
Source: Market, Angel Research; Note: Level above 50 indicates expansion
Exhibit 5: Exports and imports growth trends
Exhibit 6: Key policy rates
(%)
Exports yoy growth
Imports yoy growth
(%)
Repo rate
Reverse Repo rate
CRR
60.0
7.00
50.0
6.50
40.0
6.00
30.0
5.50
20.0
5.00
10.0
4.50
0.0
4.00
(10.0)
(20.0)
3.50
(30.0)
3.00
Source: Bloomberg, Angel Research
Source: RBI, Angel Research
Market Outlook
July 25, 2017
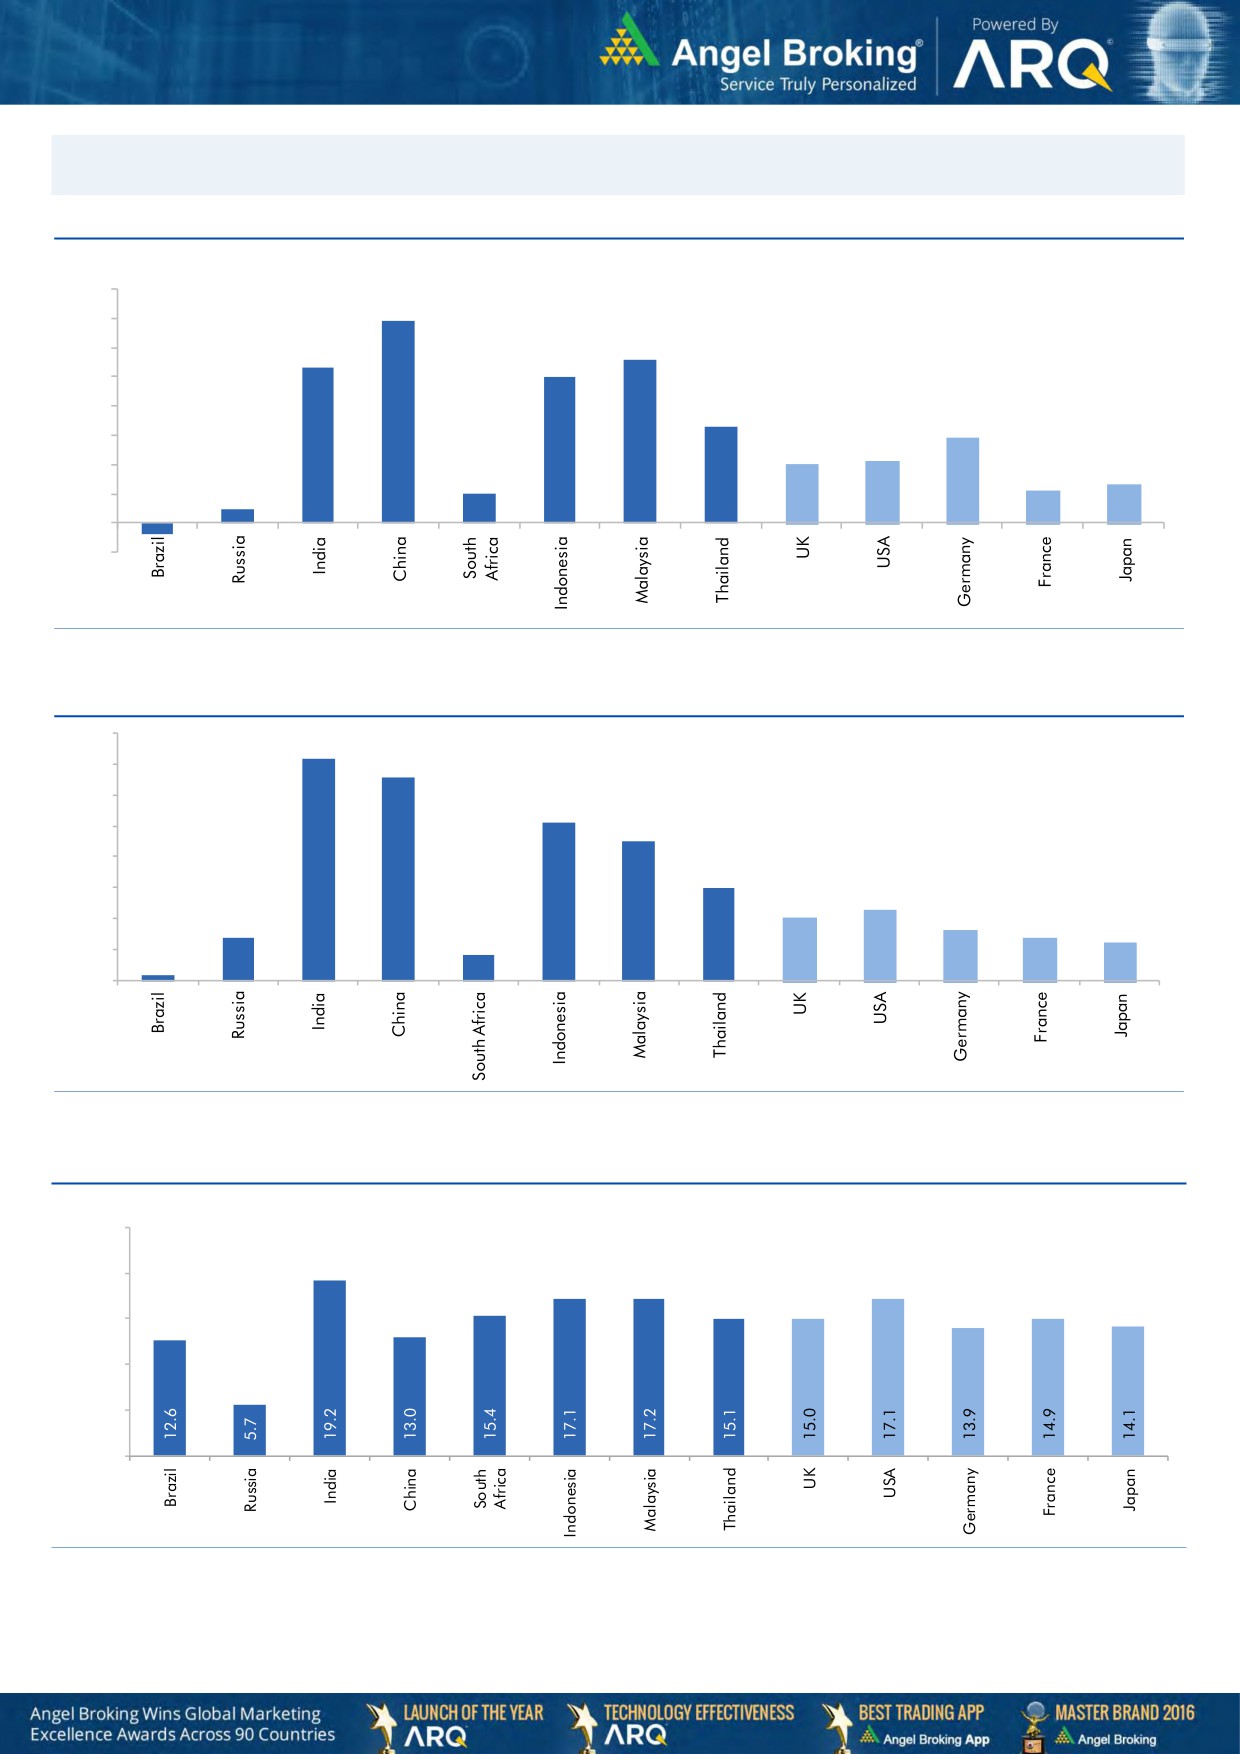
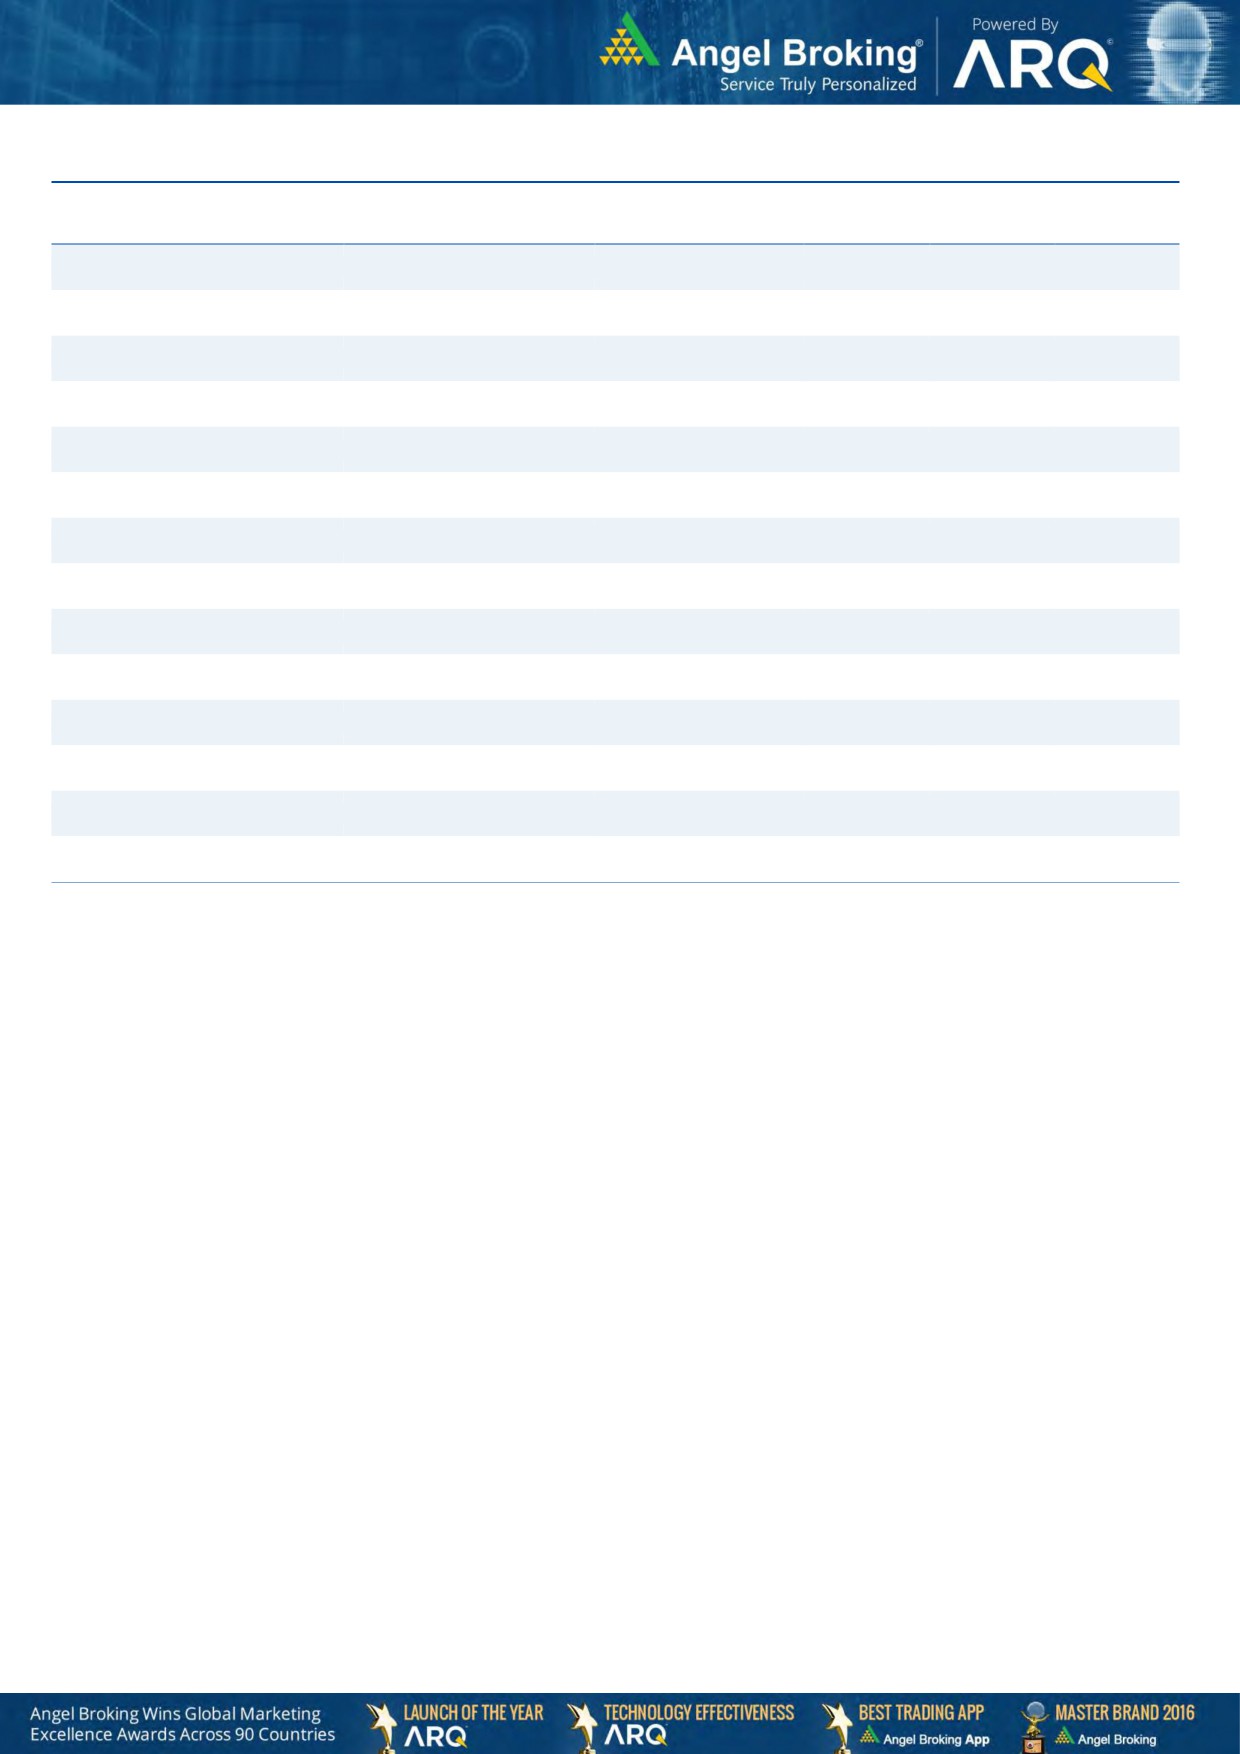
Global watch
Exhibit 1: Latest quarterly GDP Growth (%, yoy) across select developing and developed countries
(%)
8.0
6.9
7.0
5.6
6.0
5.3
5.0
1.0
5.0
4.0
3.3
2.9
3.0
2.0
2.1
2.0
0.5
1.1
1.3
1.0
-
(1.0)
(0.4)
Source: Bloomberg, Angel Research
Exhibit 2: 2016 GDP Growth projection by IMF (%, yoy) across select developing and developed countries
(%)
7.2
6.6
7.0
6.0
5.1
5.0
4.5
4.0
3.0
3.0
2.3
2.0
1.4
1.6
2.0
1.4
1.2
0.2
0.8
1.0
-
Source: IMF, Angel Research
Exhibit 3: One year forward P-E ratio across select developing and developed countries
(x)
25.0
20.0
15.0
10.0
5.0
-
Source: IMF, Angel Research
Market Outlook
July 25, 2017
Exhibit 4: Relative performance of indices across globe
Returns (%)
Country
Name of index
Closing price
1M
3M
1YR
Brazil
Bovespa
65,100
6.2
2.1
15.1
Russia
Micex
1,932
3.9
0.8
(0.3)
India
Nifty
9,966
3.5
9.3
16.9
China
Shanghai Composite
3,251
3.1
2.6
6.4
South Africa
Top 40
48,058
6.9
5.1
4.0
Mexico
Mexbol
51,666
5.4
4.6
9.6
Indonesia
LQ45
973
0.3
3.9
11.6
Malaysia
KLCI
1,762
(1.1)
1.2
5.6
Thailand
SET 50
1,001
0.8
0.7
6.1
USA
Dow Jones
21,513
0.5
4.7
16.3
UK
FTSE
7,378
(0.8)
3.7
9.7
Japan
Nikkei
19,976
(0.8)
8.4
21.9
Germany
DAX
12,209
(4.6)
1.3
18.8
France
CAC
5,128
(2.9)
(2.7)
16.3
Source: Bloomberg, Angel Research, #Data as on 24th July
Stock Watch
July 25, 2017
Company Name
Reco
CMP
Target
Mkt Cap
Sales ( Čcr )
OPM(%)
EPS (Č)
PER(x)
P/BV(x)
RoE(%)
EV/Sales(x)
(Č)
Price ( Č)
( Č cr )
FY17E FY18E
FY17E
FY18E
FY17E
FY18E
FY17E
FY18E
FY17E
FY18E
FY17E
FY18E
FY17E
FY18E
Agri / Agri Chemical
Rallis
Reduce
237
209
4,611
1,937
2,164
13.3
14.3
9.0
11.0
26.3
21.6
4.6
4.0
18.4
19.8
2.4
2.1
United Phosphorus
Neutral
866
-
44,006
15,176
17,604
18.5
18.5
37.4
44.6
23.2
19.4
4.5
3.8
21.4
21.2
3.0
2.6
Auto & Auto Ancillary
Ashok Leyland
Accumulate
104
116
30,451
20,019
22,789
11.1
11.7
4.3
5.5
24.2
19.0
4.7
4.2
19.4
22.0
1.5
1.3
Bajaj Auto
Neutral
2,827
-
81,800
25,093
27,891
19.5
19.2
143.9
162.5
19.6
17.4
5.5
4.7
30.3
29.4
3.0
2.6
Bharat Forge
Neutral
1,129
-
26,293
7,726
8,713
20.5
21.2
35.3
42.7
32.0
26.5
5.9
5.3
18.9
20.1
3.5
3.0
Eicher Motors
Neutral
28,844
-
78,519
16,583
20,447
17.5
18.0
598.0
745.2
48.2
38.7
16.5
12.6
41.2
38.3
4.6
3.6
Gabriel India
Neutral
148
-
2,126
1,544
1,715
9.0
9.3
5.4
6.3
27.4
23.5
5.2
4.6
18.9
19.5
1.3
1.2
Hero Motocorp
Neutral
3,691
-
73,711
28,120
30,753
15.2
15.6
169.1
189.2
21.8
19.5
7.5
6.3
30.8
28.2
2.4
2.2
Jamna Auto Industries Neutral
257
-
2,048
1,486
1,620
9.8
9.9
15.0
17.2
17.1
14.9
3.8
3.2
21.8
21.3
1.4
1.3
L G Balakrishnan & Bros Neutral
770
-
1,209
1,302
1,432
11.6
11.9
43.7
53.0
17.6
14.5
2.5
2.3
13.8
14.2
1.0
0.9
Mahindra and Mahindra Neutral
1,389
-
86,239
46,534
53,077
11.6
11.7
67.3
78.1
20.6
17.8
3.4
2.9
15.4
15.8
1.8
1.6
Maruti
Accumulate
7,552
8,495
228,128
67,822
83,717
15.2
15.0
243.0
291.5
31.1
25.9
7.1
5.8
22.9
22.4
3.0
2.4
Minda Industries
Neutral
760
-
6,565
2,728
3,042
9.0
9.1
68.2
86.2
11.1
8.8
2.5
2.0
23.8
24.3
2.5
2.2
Motherson Sumi
Neutral
325
-
68,376
45,896
53,687
7.8
8.3
13.0
16.1
24.9
20.2
8.0
6.4
34.7
35.4
1.6
1.3
Rane Brake Lining
Neutral
1,343
-
1,063
511
562
11.3
11.5
28.1
30.9
47.8
43.4
7.3
6.6
15.3
15.0
2.2
2.0
Setco Automotive
Neutral
42
-
564
741
837
13.0
13.0
15.2
17.0
2.8
2.5
0.5
0.4
15.8
16.3
1.1
1.0
Tata Motors
Neutral
464
-
133,857
300,209
338,549
8.9
8.4
42.7
54.3
10.9
8.6
1.7
1.5
15.6
17.2
0.6
0.5
TVS Motor
Neutral
577
-
27,410
13,390
15,948
6.9
7.1
12.8
16.5
45.2
34.9
11.3
8.9
26.3
27.2
2.1
1.7
Amara Raja Batteries
Accumulate
843
962
14,404
5,339
6,220
15.9
15.3
28.0
32.3
30.1
26.1
5.7
4.8
19.1
18.5
2.7
2.3
Exide Industries
Neutral
215
-
18,279
7,439
8,307
15.0
15.0
8.1
9.3
26.6
23.1
3.7
3.3
14.3
16.7
2.1
1.9
Apollo Tyres
Neutral
254
-
12,919
12,877
14,504
14.3
13.9
21.4
23.0
11.8
11.0
1.8
1.6
16.4
15.2
1.2
1.1
Ceat
Neutral
1,841
-
7,448
7,524
8,624
13.0
12.7
131.1
144.3
14.1
12.8
2.6
2.2
19.8
18.6
1.1
0.9
JK Tyres
Neutral
160
-
3,635
7,455
8,056
15.0
15.0
21.8
24.5
7.4
6.5
1.5
1.3
22.8
21.3
0.6
0.5
Swaraj Engines
Neutral
2,183
-
2,711
660
810
15.2
16.4
54.5
72.8
40.1
30.0
12.5
11.3
31.5
39.2
3.9
3.2
Subros
Neutral
240
-
1,437
1,488
1,681
11.7
11.9
6.4
7.2
37.4
33.4
4.0
3.6
10.8
11.4
1.2
1.0
Indag Rubber
Neutral
203
-
532
286
326
19.8
16.8
11.7
13.3
17.3
15.2
2.9
2.7
17.8
17.1
1.5
1.3
Capital Goods
ACE
Neutral
72
-
708
709
814
4.1
4.6
1.4
2.1
51.1
34.1
2.1
2.0
4.4
6.0
1.2
1.0
BEML
Neutral
1,650
-
6,870
3,451
4,055
6.3
9.2
31.4
57.9
52.5
28.5
3.2
2.9
6.3
10.9
2.1
1.8
Bharat Electronics
Neutral
173
-
38,564
8,137
9,169
16.8
17.2
58.7
62.5
2.9
2.8
0.5
0.4
44.6
46.3
3.7
3.3
Stock Watch
July 25, 2017
Company Name
Reco
CMP
Target
Mkt Cap
Sales ( Čcr )
OPM(%)
EPS (Č)
PER(x)
P/BV(x)
RoE(%)
EV/Sales(x)
(Č)
Price ( Č)
( Č cr )
FY17E
FY18E
FY17E
FY18E
FY17E
FY18E
FY17E
FY18E
FY17E
FY18E
FY17E
FY18E
FY17E
FY18E
Capital Goods
Voltas
Neutral
500
-
16,554
6,511
7,514
7.9
8.7
12.9
16.3
38.8
30.7
7.0
6.1
16.7
18.5
2.3
2.0
BGR Energy
Neutral
149
-
1,078
16,567
33,848
6.0
5.6
7.8
5.9
19.2
25.3
1.1
1.1
4.7
4.2
0.2
0.1
BHEL
Neutral
146
-
35,759
28,797
34,742
-
2.8
2.3
6.9
63.5
21.2
1.1
1.0
1.3
4.8
0.9
0.6
Blue Star
Accumulate
671
760
6,422
4,283
5,077
5.9
7.3
14.9
22.1
45.1
30.3
8.7
7.4
20.4
26.4
1.5
1.3
CG Power and Industrial
Neutral
85
-
5,337
5,777
6,120
5.9
7.0
3.3
4.5
25.8
18.9
1.1
1.1
4.4
5.9
0.9
0.8
Solutions
Greaves Cotton
Neutral
167
-
4,076
1,755
1,881
16.8
16.9
7.8
8.5
21.4
19.6
4.3
4.0
20.6
20.9
2.0
1.8
Inox Wind
Neutral
133
-
2,958
5,605
6,267
15.7
16.4
24.8
30.0
5.4
4.4
1.5
1.1
25.9
24.4
0.6
0.5
KEC International
Neutral
288
-
7,407
9,294
10,186
7.9
8.1
9.9
11.9
29.1
24.2
4.3
3.7
15.6
16.3
1.0
0.9
KEI Industries
Accumulate
233
258
1,813
2,633
3,001
10.4
10.0
12.7
13.0
18.3
17.9
3.9
3.3
21.4
18.2
0.9
0.8
Thermax
Neutral
915
-
10,906
5,421
5,940
7.3
7.3
25.7
30.2
35.6
30.3
4.3
3.9
12.2
13.1
1.9
1.7
VATech Wabag
Buy
590
681
3,219
3,136
3,845
8.9
9.1
26.0
35.9
22.7
16.4
2.8
2.4
13.4
15.9
0.9
0.7
Cement
ACC
Neutral
1,727
-
32,435
11,225
13,172
13.2
16.9
44.5
75.5
38.8
22.9
3.7
3.4
11.2
14.2
2.9
2.5
Ambuja Cements
Neutral
268
-
53,176
9,350
10,979
18.2
22.5
5.8
9.5
46.2
28.2
3.9
3.5
10.2
12.5
5.7
4.8
India Cements
Neutral
209
-
6,437
4,364
4,997
18.5
19.2
7.9
11.3
26.4
18.5
1.9
1.9
8.0
8.5
2.2
2.0
JK Cement
Neutral
985
-
6,883
4,398
5,173
15.5
17.5
31.2
55.5
31.6
17.7
3.8
3.3
12.0
15.5
2.1
1.8
J K Lakshmi Cement
Neutral
468
-
5,510
2,913
3,412
14.5
19.5
7.5
22.5
62.4
20.8
3.8
3.2
12.5
18.0
2.5
2.1
Orient Cement
Neutral
159
-
3,264
2,114
2,558
18.5
20.5
8.1
11.3
19.7
14.1
2.9
2.5
9.0
14.0
2.2
1.7
UltraTech Cement
Neutral
4,185
-
114,883
25,768
30,385
21.0
23.5
111.0
160.0
37.7
26.2
4.8
4.2
13.5
15.8
4.6
3.8
Construction
ITNL
Neutral
94
-
3,102
8,946
10,017
31.0
31.6
8.1
9.1
11.6
10.4
0.4
0.4
4.2
5.0
3.7
3.4
KNR Constructions
Neutral
211
-
2,967
1,385
1,673
14.7
14.0
41.2
48.5
5.1
4.4
1.0
0.8
14.9
15.2
2.2
1.8
Larsen & Toubro
Buy
1,179
1,700
165,032
111,017
124,908
11.0
11.0
61.1
66.7
19.3
17.7
2.3
2.2
13.1
12.9
2.5
2.3
Gujarat Pipavav Port
Neutral
146
-
7,061
705
788
52.2
51.7
5.0
5.6
29.2
26.1
2.9
2.6
11.2
11.2
9.7
8.2
Nagarjuna Const.
Neutral
92
-
5,087
8,842
9,775
9.1
8.8
5.3
6.4
17.3
14.3
1.4
1.3
8.2
9.1
0.7
0.6
PNC Infratech
Neutral
142
-
3,642
2,350
2,904
13.1
13.2
9.0
8.8
15.8
16.1
0.6
0.5
15.9
13.9
1.7
1.4
Simplex Infra
Neutral
498
-
2,463
6,829
7,954
10.5
10.5
31.4
37.4
15.9
13.3
1.6
1.5
9.9
13.4
0.8
0.7
Power Mech Projects
Neutral
585
-
861
1,801
2,219
12.7
14.6
72.1
113.9
8.1
5.1
1.5
1.3
16.8
11.9
0.5
0.4
Sadbhav Engineering
Accumulate
281
298
4,818
3,598
4,140
10.3
10.6
9.0
11.9
31.2
23.6
3.3
2.9
9.9
11.9
1.6
1.4
NBCC
Neutral
215
-
19,350
7,428
9,549
7.9
8.6
8.2
11.0
26.2
19.6
1.3
1.0
28.2
28.7
2.3
1.7
MEP Infra
Neutral
129
-
2,100
1,877
1,943
30.6
29.8
3.0
4.2
43.1
30.8
20.8
14.0
0.6
0.6
2.5
2.3
Stock Watch
July 25, 2017
Company Name
Reco
CMP
Target
Mkt Cap
Sales ( Čcr )
OPM(%)
EPS (Č)
PER(x)
P/BV(x)
RoE(%)
EV/Sales(x)
(Č)
Price ( Č)
( Č cr )
FY17E
FY18E
FY17E
FY18E
FY17E
FY18E
FY17E
FY18E
FY17E
FY18E
FY17E
FY18E
FY17E
FY18E
Construction
SIPL
Neutral
107
-
3,753
1,036
1,252
65.5
66.2
(8.4)
(5.6)
4.0
4.6
(22.8)
(15.9)
11.8
9.8
Engineers India
Neutral
165
-
11,112
1,725
1,935
16.0
19.1
11.4
13.9
14.5
11.9
2.0
1.9
13.4
15.3
5.4
4.8
Financials
Axis Bank
Accumulate
534
580
128,081
46,932
53,575
3.5
3.4
32.4
44.6
16.5
12.0
2.1
1.9
13.6
16.5
-
-
Bank of Baroda
Neutral
164
-
37,800
19,980
23,178
1.8
1.8
11.5
17.3
14.3
9.5
1.6
1.3
8.3
10.1
-
-
Canara Bank
Neutral
353
-
21,093
15,225
16,836
1.8
1.8
14.5
28.0
24.4
12.6
1.7
1.4
5.8
8.5
-
-
Can Fin Homes
Neutral
3,061
-
8,150
420
526
3.5
3.5
86.5
107.8
35.4
28.4
7.6
6.2
23.6
24.1
-
-
Cholamandalam Inv. &
Accumulate
1,130
1,230
17,653
2,012
2,317
6.3
6.3
42.7
53.6
26.5
21.1
4.2
3.6
16.9
18.3
-
-
Fin. Co.
Dewan Housing Finance Accumulate
456
520
14,295
2,225
2,688
2.9
2.9
29.7
34.6
15.4
13.2
2.5
1.6
16.1
14.8
-
-
Equitas Holdings
Buy
168
235
5,671
939
1,281
11.7
11.5
5.8
8.2
28.9
20.4
2.5
2.2
10.9
11.5
-
-
Federal Bank
Accumulate
117
125
22,743
8,259
8,995
3.0
3.0
4.3
5.6
27.2
20.9
2.3
2.1
8.5
10.1
-
-
HDFC
Neutral
1,635
-
260,438
11,475
13,450
3.4
3.4
45.3
52.5
36.1
31.1
7.0
6.2
20.2
20.5
-
-
HDFC Bank
Accumulate
1,735
1,850
446,453
46,097
55,433
4.5
4.5
58.4
68.0
29.7
25.5
5.2
4.4
18.8
18.6
-
-
ICICI Bank
Neutral
303
-
194,281
42,800
44,686
3.1
3.3
18.0
21.9
16.8
13.8
2.3
2.1
11.1
12.3
-
-
Karur Vysya Bank
Accumulate
141
160
8,509
5,640
6,030
3.3
3.2
8.9
10.0
15.8
14.1
1.7
1.6
11.2
11.4
-
-
Lakshmi Vilas Bank
Neutral
199
-
3,812
3,339
3,799
2.7
2.8
11.0
14.0
18.1
14.2
1.9
1.7
11.2
12.7
-
-
LIC Housing Finance
Neutral
742
-
37,469
3,712
4,293
2.6
2.5
39.0
46.0
19.0
16.1
3.6
3.1
19.9
20.1
-
-
Punjab Natl.Bank
Neutral
161
-
34,324
23,532
23,595
2.3
2.4
6.8
12.6
23.7
12.8
3.7
2.6
3.3
6.5
-
-
RBL Bank
Neutral
524
-
19,744
1,783
2,309
2.6
2.6
12.7
16.4
41.3
32.0
4.5
4.0
12.8
13.3
-
-
Repco Home Finance
Accumulate
781
825
4,884
388
457
4.5
4.2
30.0
38.0
26.0
20.5
4.3
3.6
18.0
19.2
-
-
South Ind.Bank
Neutral
29
-
5,284
6,435
7,578
2.5
2.5
2.7
3.1
10.9
9.5
1.4
1.2
10.1
11.2
-
-
St Bk of India
Neutral
294
-
254,171
88,650
98,335
2.6
2.6
13.5
18.8
21.8
15.7
2.1
1.8
7.0
8.5
-
-
Union Bank
Neutral
157
-
10,813
13,450
14,925
2.3
2.3
25.5
34.5
6.2
4.6
0.9
0.8
7.5
10.2
-
-
Yes Bank
Neutral
1,593
-
72,856
8,978
11,281
3.3
3.4
74.0
90.0
21.5
17.7
4.1
3.5
17.0
17.2
-
-
FMCG
Akzo Nobel India
Neutral
1,770
-
8,489
2,955
3,309
13.3
13.7
57.2
69.3
31.0
25.5
10.1
8.5
32.7
33.3
2.7
2.4
Asian Paints
Neutral
1,156
-
110,888
17,128
18,978
16.8
16.4
19.1
20.7
60.5
55.9
21.1
19.9
34.8
35.5
6.4
5.8
Britannia
Neutral
3,825
-
45,917
9,594
11,011
14.6
14.9
80.3
94.0
47.6
40.7
19.6
15.1
41.2
-
4.6
4.0
Colgate
Neutral
1,070
-
29,094
4,605
5,149
23.4
23.4
23.8
26.9
45.0
39.8
24.9
19.5
64.8
66.8
6.2
5.6
Dabur India
Neutral
306
-
53,867
8,315
9,405
19.8
20.7
8.1
9.2
37.8
33.2
10.5
8.7
31.6
31.0
6.1
5.4
GlaxoSmith Con*
Neutral
5,516
-
23,198
4,350
4,823
21.2
21.4
179.2
196.5
30.8
28.1
8.2
6.9
27.1
26.8
4.7
4.2
Stock Watch
July 25, 2017
Company Name
Reco
CMP
Target
Mkt Cap
Sales ( Čcr )
OPM(%)
EPS (Č)
PER(x)
P/BV(x)
RoE(%)
EV/Sales(x)
(Č)
Price ( Č)
( Č cr )
FY17E FY18E
FY17E
FY18E
FY17E
FY18E
FY17E
FY18E
FY17E
FY18E
FY17E
FY18E
FY17E
FY18E
FMCG
Godrej Consumer
Neutral
991
-
67,490
10,235
11,428
18.4
18.6
41.1
44.2
24.1
22.4
5.4
4.5
24.9
24.8
6.7
5.9
HUL
Neutral
1,158
-
250,602
35,252
38,495
17.8
17.8
20.7
22.4
56.1
51.7
53.6
46.0
95.6
88.9
7.0
6.4
ITC
Neutral
293
-
356,585
40,059
44,439
38.3
39.2
9.0
10.1
32.7
28.9
9.1
8.0
27.8
27.5
8.4
7.6
Marico
Neutral
331
-
42,650
6,430
7,349
18.8
19.5
6.4
7.7
51.6
42.9
15.6
13.1
33.2
32.5
6.4
5.6
Nestle*
Neutral
6,830
-
65,852
10,073
11,807
20.7
21.5
124.8
154.2
54.7
44.3
22.5
20.2
34.8
36.7
6.4
5.4
Tata Global
Neutral
170
-
10,729
8,675
9,088
9.8
9.8
7.4
8.2
23.0
20.7
1.8
1.7
7.9
8.1
1.2
1.1
Procter & Gamble
Neutral
8,229
-
26,712
2,939
3,342
23.2
23.0
146.2
163.7
56.3
50.3
14.3
11.8
25.3
23.5
8.6
7.5
Hygiene
IT
HCL Tech^
Accumulate
903
1,014
128,864
46,723
52,342
22.1
20.9
60.0
62.8
15.1
14.4
3.8
3.2
25.3
22.4
2.5
2.1
Infosys
Buy
991
1,179
227,673
68,484
73,963
26.0
26.0
63.0
64.0
15.7
15.5
3.3
3.0
20.8
19.7
3.0
2.6
TCS
Neutral
2,533
-
499,040
117,966
127,403
27.5
27.6
134.3
144.5
18.9
17.5
5.6
5.2
29.8
29.7
3.9
3.6
Tech Mahindra
Buy
399
533
38,907
29,141
31,051
14.4
15.0
32.3
35.6
12.4
11.2
2.1
1.9
17.1
17.0
1.2
1.0
Wipro
Neutral
292
-
142,002
55,421
58,536
20.3
20.3
35.1
36.5
8.3
8.0
1.4
1.2
19.2
14.6
2.0
1.7
Media
D B Corp
Neutral
372
-
6,838
2,297
2,590
27.4
28.2
21.0
23.4
17.7
15.9
4.1
3.6
23.7
23.1
2.8
2.4
HT Media
Neutral
88
-
2,055
2,693
2,991
12.6
12.9
7.9
9.0
11.2
9.8
1.0
0.9
7.8
8.3
0.3
0.2
Jagran Prakashan
Buy
174
225
5,685
2,283
2,555
28.0
28.0
10.6
12.3
16.4
14.2
3.5
3.0
21.4
21.4
2.5
2.2
Sun TV Network
Neutral
810
-
31,911
2,850
3,265
70.1
71.0
26.2
30.4
30.9
26.6
7.9
7.0
24.3
25.6
10.8
9.3
Hindustan Media
Neutral
276
-
2,026
1,016
1,138
24.3
25.2
27.3
30.1
10.1
9.2
1.9
1.7
16.2
15.8
1.3
1.1
Ventures
TV Today Network
Buy
249
344
1,486
608
667
21.5
22.3
15.7
19.2
15.9
13.0
2.4
2.1
16.1
16.0
2.0
1.8
Music Broadcast Limited Buy
365
434
2,084
271
317
91.0
109.0
6.0
10.0
60.9
36.5
3.8
3.5
6.5
9.3
7.3
6.0
Metals & Mining
Coal India
Neutral
261
-
162,231
84,638
94,297
21.4
22.3
24.5
27.1
10.7
9.6
4.4
4.2
42.6
46.0
1.4
1.3
Hind. Zinc
Neutral
278
-
117,570
14,252
18,465
55.9
48.3
15.8
21.5
17.6
12.9
2.9
2.5
17.0
20.7
8.3
6.4
Hindalco
Neutral
214
-
47,977
107,899
112,095
7.4
8.2
9.2
13.0
23.2
16.5
1.1
1.1
4.8
6.6
1.0
0.9
JSW Steel
Neutral
214
-
51,729
53,201
58,779
16.1
16.2
130.6
153.7
1.6
1.4
0.2
0.2
14.0
14.4
1.7
1.5
NMDC
Neutral
122
-
38,694
6,643
7,284
44.4
47.7
7.1
7.7
17.2
15.9
1.5
1.5
8.8
9.2
3.6
3.2
SAIL
Neutral
63
-
26,123
47,528
53,738
(0.7)
2.1
(1.9)
2.6
24.3
0.7
0.7
(1.6)
3.9
1.4
1.3
Vedanta
Neutral
265
-
98,357
71,744
81,944
19.2
21.7
13.4
20.1
19.8
13.2
1.7
1.5
8.4
11.3
1.8
1.4
Tata Steel
Neutral
547
-
53,169
121,374
121,856
7.2
8.4
18.6
34.3
29.4
16.0
1.8
1.7
6.1
10.1
1.1
1.1
Oil & Gas
GAIL
Neutral
376
-
63,559
56,220
65,198
9.3
10.1
27.1
33.3
13.9
11.3
1.3
1.2
9.3
10.7
1.3
1.1
ONGC
Neutral
163
-
209,438
137,222
152,563
15.0
21.8
19.5
24.1
8.4
6.8
0.7
0.7
8.5
10.1
1.8
1.6
Stock Watch
July 25, 2017
Company Name
Reco
CMP
Target
Mkt Cap
Sales ( Čcr )
OPM(%)
EPS (Č)
PER(x)
P/BV(x)
RoE(%)
EV/Sales(x)
(Č)
Price ( Č)
( Č cr )
FY17E FY18E
FY17E
FY18E
FY17E
FY18E
FY17E
FY18E
FY17E
FY18E
FY17E
FY18E
FY17E
FY18E
Oil & Gas
Indian Oil Corp
Neutral
378
-
183,626
373,359
428,656
5.9
5.5
54.0
59.3
7.0
6.4
1.1
1.0
16.0
15.6
0.6
0.6
Reliance Industries
Neutral
1,616
-
525,513
301,963
358,039
12.1
12.6
87.7
101.7
18.4
15.9
1.9
1.7
10.7
11.3
2.2
1.8
Pharmaceuticals
Alembic Pharma
Buy
546
648
10,289
3,101
3,966
19.7
20.5
21.4
25.5
25.5
21.4
5.4
4.4
23.0
22.8
3.3
2.4
Alkem Laboratories Ltd
Buy
1,797
2,161
21,487
5,853
6,901
17.1
18.4
74.6
85.0
24.1
21.1
5.1
4.3
21.1
20.2
3.6
3.1
Aurobindo Pharma
Accumulate
745
823
43,651
14,845
17,086
21.5
22.1
39.4
44.7
18.9
16.7
4.7
3.7
27.6
24.7
3.1
2.7
Aventis*
Neutral
4,287
-
9,872
2,206
2,508
16.6
16.8
128.9
139.9
33.3
30.6
5.7
4.5
21.6
23.5
4.2
3.6
Cadila Healthcare
Sell
532
450
54,427
9,220
11,584
18.4
20.3
14.5
18.7
36.7
28.4
7.8
6.3
23.5
24.6
6.2
4.8
Cipla
Sell
570
461
45,830
14,281
16,619
15.4
16.2
12.5
19.7
45.6
28.9
3.7
3.3
8.4
12.0
3.4
2.9
Dr Reddy's
Neutral
2,692
-
44,628
14,081
15,937
16.1
18.6
72.6
105.9
37.1
25.4
3.6
3.3
9.6
13.6
3.4
3.0
Dishman Pharma
Sell
143
1,718
1,890
22.7
22.8
9.5
11.3
10.1
10.9
3.3
2.9
GSK Pharma*
Neutral
2,556
-
21,650
2,927
3,290
11.8
16.2
34.4
49.6
74.3
51.5
10.8
11.2
13.9
21.3
7.2
6.5
Indoco Remedies
Sell
203
153
1,874
1,067
1,154
12.1
14.9
8.4
11.3
24.2
18.0
2.9
2.6
12.6
15.0
1.9
1.8
Ipca labs
Buy
479
620
6,048
3,211
3,593
13.9
14.5
15.4
19.4
31.1
24.7
2.5
2.3
8.2
9.5
2.0
1.8
Lupin
Buy
1,143
1,526
51,616
17,120
18,657
24.1
24.1
56.9
61.1
20.1
18.7
3.8
3.2
20.7
18.6
3.3
2.7
Natco Pharma
Accumulate
991
1,060
17,273
2,065
1,988
33.1
33.7
27.9
25.7
35.5
38.6
10.4
8.8
29.2
22.9
8.5
8.5
Sun Pharma
Buy
571
712
137,069
30,264
32,899
29.0
26.9
32.7
31.6
17.5
18.1
3.8
3.2
22.2
18.7
4.3
3.8
Power
Tata Power
Neutral
83
-
22,517
36,916
39,557
17.4
27.1
5.1
6.3
16.3
13.2
1.4
1.3
9.0
10.3
1.6
1.5
NTPC
Neutral
164
-
135,267
86,605
95,545
17.5
20.8
11.8
13.4
13.9
12.2
1.4
1.3
10.5
11.1
2.9
2.9
Power Grid
Neutral
217
-
113,447
25,315
29,193
88.2
88.7
14.2
17.2
15.3
12.6
2.3
2.0
15.2
16.1
9.1
8.2
Real Estate
Prestige Estate
Neutral
251
-
9,413
4,707
5,105
25.2
26.0
10.3
13.0
24.4
19.3
2.0
1.8
10.3
10.2
3.2
2.8
MLIFE
Buy
435
522
2,233
1,152
1,300
22.7
24.6
29.9
35.8
14.6
12.2
1.1
1.0
7.6
8.6
2.7
2.2
Telecom
Bharti Airtel
Neutral
420
-
167,971
105,086
114,808
34.5
34.7
12.2
16.4
34.4
25.6
2.3
2.2
6.8
8.4
2.5
2.2
Idea Cellular
Neutral
92
-
33,122
40,133
43,731
37.2
37.1
6.4
6.5
14.4
14.1
1.2
1.1
8.2
7.6
1.8
1.6
zOthers
Abbott India
Neutral
4,509
-
9,580
3,153
3,583
14.1
14.4
152.2
182.7
29.6
24.7
145.4
124.2
25.6
26.1
2.8
2.4
Asian Granito
Accumulate
426
480
1,283
1,066
1,169
11.6
12.5
13.0
16.0
32.8
26.7
3.2
2.9
9.5
10.7
1.5
1.3
Bajaj Electricals
Buy
338
395
3,427
4,801
5,351
5.7
6.2
10.4
13.7
32.4
24.7
4.0
3.6
12.4
14.5
0.7
0.6
Banco Products (India)
Neutral
236
-
1,689
1,353
1,471
12.3
12.4
14.5
16.3
16.3
14.5
22.5
20.3
14.5
14.6
1.2
127.9
Coffee Day Enterprises
Neutral
250
-
5,141
2,964
3,260
20.5
21.2
4.7
8.0
-
31.2
2.9
2.6
5.5
8.5
2.1
1.9
Ltd
Competent Automobiles Neutral
229
-
147
1,137
1,256
3.1
2.7
28.0
23.6
8.2
9.7
44.0
39.8
14.3
11.5
0.1
0.1
Stock Watch
July 25, 2017
Company Name
Reco
CMP
Target
Mkt Cap
Sales ( Čcr )
OPM(%)
EPS (Č)
PER(x)
P/BV(x)
RoE(%)
EV/Sales(x)
(Č)
Price ( Č)
( Č cr )
FY17E
FY18E
FY17E
FY18E
FY17E
FY18E
FY17E
FY18E
FY17E
FY18E
FY17E
FY18E
FY17E
FY18E
zOthers
Elecon Engineering
Neutral
61
-
679
1,482
1,660
13.7
14.5
3.9
5.8
15.5
10.4
3.7
3.4
7.8
10.9
0.8
0.7
Finolex Cables
Neutral
487
-
7,449
2,883
3,115
12.0
12.1
14.2
18.6
34.3
26.2
18.2
16.0
15.8
14.6
2.3
2.1
Garware Wall Ropes
Neutral
890
-
1,947
863
928
15.1
15.2
36.4
39.4
24.5
22.6
4.4
3.8
17.5
15.9
2.2
2.0
Goodyear India*
Neutral
894
-
2,062
1,598
1,704
10.4
10.2
49.4
52.6
18.1
17.0
83.6
73.3
18.2
17.0
1.0
139.3
Hitachi
Neutral
2,000
-
5,438
2,081
2,433
8.8
8.9
33.4
39.9
59.9
50.1
48.3
40.3
22.1
21.4
2.6
2.2
HSIL
Neutral
394
-
2,847
2,384
2,515
15.8
16.3
15.3
19.4
25.7
20.3
25.6
22.0
7.8
9.3
1.4
1.3
Interglobe Aviation
Neutral
1,233
-
44,598
21,122
26,005
14.5
27.6
110.7
132.1
11.1
9.3
66.7
47.6
168.5
201.1
2.1
1.7
Jyothy Laboratories
Neutral
378
-
6,873
1,440
2,052
11.5
13.0
8.5
10.0
44.5
37.8
10.8
10.0
18.6
19.3
5.1
3.5
Kirloskar Engines India
Neutral
400
-
5,785
2,554
2,800
9.9
10.0
10.5
12.1
38.1
33.1
15.9
15.0
10.7
11.7
1.9
1.7
Ltd
Linc Pen & Plastics
Neutral
274
-
404
382
420
9.3
9.5
13.5
15.7
20.3
17.4
3.5
3.0
17.1
17.3
1.1
1.0
M M Forgings
Neutral
624
-
753
546
608
20.4
20.7
41.3
48.7
15.1
12.8
85.5
75.7
16.6
17.0
1.2
1.1
Manpasand Bever.
Neutral
781
-
4,467
836
1,087
19.6
19.4
16.9
23.8
46.2
32.8
5.5
4.8
12.0
14.8
5.1
3.8
Mirza International
Neutral
165
-
1,986
963
1,069
17.2
18.0
6.1
7.5
26.9
22.0
4.1
3.5
15.0
15.7
2.3
2.0
MT Educare
Neutral
75
-
298
366
417
17.7
18.2
9.4
10.8
8.0
6.9
1.8
1.5
22.2
22.3
0.7
0.6
Narayana Hrudaya
Neutral
300
-
6,123
1,873
2,166
11.5
11.7
2.6
4.0
113.3
75.6
7.0
6.3
6.1
8.3
3.4
2.9
Navkar Corporation
Buy
205
265
2,924
347
371
43.2
37.3
6.7
6.0
30.7
34.2
2.1
1.9
6.2
10.6
9.5
8.9
Navneet Education
Neutral
169
-
3,946
1,062
1,147
24.0
24.0
6.1
6.6
27.7
25.5
5.7
5.1
20.6
19.8
3.8
3.5
Nilkamal
Neutral
1,901
-
2,837
1,995
2,165
10.7
10.4
69.8
80.6
27.2
23.6
108.6
94.4
16.6
16.5
1.4
1.3
Page Industries
Neutral
16,735
-
18,667
2,450
3,124
20.1
17.6
299.0
310.0
56.0
54.0
372.7
284.5
47.1
87.5
7.7
6.0
Parag Milk Foods
Neutral
253
-
2,131
1,919
2,231
9.3
9.6
9.5
12.9
26.8
19.6
4.2
3.4
15.5
17.5
1.3
1.1
Quick Heal
Neutral
220
-
1,545
408
495
27.3
27.0
7.7
8.8
28.4
25.0
2.6
2.6
9.3
10.6
2.9
2.4
Radico Khaitan
Buy
127
147
1,690
1,667
1,824
13.0
13.2
6.7
8.2
19.1
15.5
1.7
1.6
9.0
10.2
1.4
1.3
Relaxo Footwears
Neutral
481
-
5,775
2,085
2,469
9.2
8.2
7.6
8.0
63.6
60.5
24.7
21.1
17.9
18.8
2.9
2.4
S H Kelkar & Co.
Neutral
276
-
3,990
1,036
1,160
15.1
15.0
6.1
7.2
45.2
38.4
4.8
4.4
10.7
11.5
3.7
3.3
Siyaram Silk Mills
Accumulate
2,324
2,500
2,178
1,574
1,769
12.5
12.7
97.1
113.1
23.9
20.5
3.7
3.2
15.4
15.5
1.6
1.4
Styrolution ABS India*
Neutral
1,072
-
1,885
1,440
1,537
9.2
9.0
40.6
42.6
26.4
25.2
67.4
61.3
12.3
11.6
1.3
1.1
Surya Roshni
Neutral
290
-
1,273
3,342
3,625
7.8
7.5
17.3
19.8
16.8
14.7
31.9
25.6
10.5
10.8
0.6
0.6
Team Lease Serv.
Neutral
1,360
-
2,324
3,229
4,001
1.5
1.8
22.8
32.8
59.7
41.4
6.4
5.5
10.7
13.4
0.6
0.5
The Byke Hospitality
Neutral
189
-
758
287
384
20.5
20.5
7.6
10.7
24.9
17.7
5.2
4.2
20.7
23.5
2.7
2.0
Stock Watch
July 25, 2017
Company Name
Reco
CMP
Target Mkt Cap
Sales ( Čcr )
OPM(%)
EPS (Č)
PER(x)
P/BV(x)
RoE(%)
EV/Sales(x)
(Č)
Price ( Č)
( Č cr )
FY17E FY18E FY17E FY18E FY17E FY18E FY17E FY18E FY17E FY18E FY17E FY18E FY17E FY18E
zOthers
Transport Corporation of
Neutral
318
-
2,432
2,671
2,911
8.5
8.8
13.9
15.7
22.9
20.3
3.1
2.8
13.7
13.8
1.0
0.9
India
TVS Srichakra
Neutral
3,675
-
2,814
2,304
2,614
13.7
13.8
231.1
266.6
15.9
13.8
412.9
325.1
33.9
29.3
1.2
1.1
UFO Moviez
Neutral
395
-
1,090
619
685
33.2
33.4
30.0
34.9
13.2
11.3
1.8
1.6
13.8
13.9
1.5
1.1
Visaka Industries
Neutral
478
-
759
1,051
1,138
10.3
10.4
21.0
23.1
22.7
20.6
61.3
57.4
9.0
9.2
1.0
0.9
VRL Logistics
Neutral
323
-
2,947
1,902
2,119
16.7
16.6
14.6
16.8
22.2
19.2
4.9
4.3
21.9
22.2
1.7
1.5
VIP Industries
Buy
178
218
2,515
1,270
1,450
10.4
10.4
5.6
6.5
31.8
27.4
6.6
5.7
20.7
21.1
2.0
1.7
Navin Fluorine
Accumulate
648
730
3,194
789
945
21.1
22.4
24.0
28.7
27.0
22.6
4.3
3.7
17.8
18.5
4.0
3.2
Source: Company, Angel Research; Note: *December year end; #September year end; &October year end; Price as on July 24, 2017
Market Outlook
July 25, 2017
Research Team Tel: 022 - 39357800
DISCLAIMER
Angel Broking Private Limited (hereinafter referred to as “Angel”) is a registered Member of National Stock Exchange of India
Limited,Bombay Stock Exchange Limited and Metropolitan Stock Exchange Limited. It is also registered as a Depository Participant with
CDSL and Portfolio Manager with SEBI. It also has registration with AMFI as a Mutual Fund Distributor. Angel Broking Private Limited is a
registered entity with SEBI for Research Analyst in terms of SEBI (Research Analyst) Regulations, 2014 vide registration number
INH000000164. Angel or its associates has not been debarred/ suspended by SEBI or any other regulatory authority for accessing
/dealing in securities Market. Angel or its associates/analyst has not received any compensation / managed or
co-managed public offering of securities of the company covered by Analyst during the past twelve months.
This document is solely for the personal information of the recipient, and must not be singularly used as the basis of any investment
decision. Nothing in this document should be construed as investment or financial advice. Each recipient of this document should make
such investigations as they deem necessary to arrive at an independent evaluation of an investment in the securities of the companies
referred to in this document (including the merits and risks involved), and should consult their own advisors to determine the merits and
risks of such an investment.
Reports based on technical and derivative analysis center on studying charts of a stock's price movement, outstanding positions and
trading volume, as opposed to focusing on a company's fundamentals and, as such, may not match with a report on a company's
fundamentals. Investors are advised to refer the Fundamental and Technical Research Reports available on our website to evaluate the
contrary view, if any.
The information in this document has been printed on the basis of publicly available information, internal data and other reliable
sources believed to be true, but we do not represent that it is accurate or complete and it should not be relied on as such, as this
document is for general guidance only. Angel Broking Pvt. Limited or any of its affiliates/ group companies shall not be in any way
responsible for any loss or damage that may arise to any person from any inadvertent error in the information contained in this report.
Angel Broking Pvt. Limited has not independently verified all the information contained within this document. Accordingly, we cannot
testify, nor make any representation or warranty, express or implied, to the accuracy, contents or data contained within this document.
While Angel Broking Pvt. Limited endeavors to update on a reasonable basis the information discussed in this material, there may be
regulatory, compliance, or other reasons that prevent us from doing so.
This document is being supplied to you solely for your information, and its contents, information or data may not be reproduced,
redistributed or passed on, directly or indirectly.
Neither Angel Broking Pvt. Limited, nor its directors, employees or affiliates shall be liable for any loss or damage that may arise from
or in connection with the use of this information.